
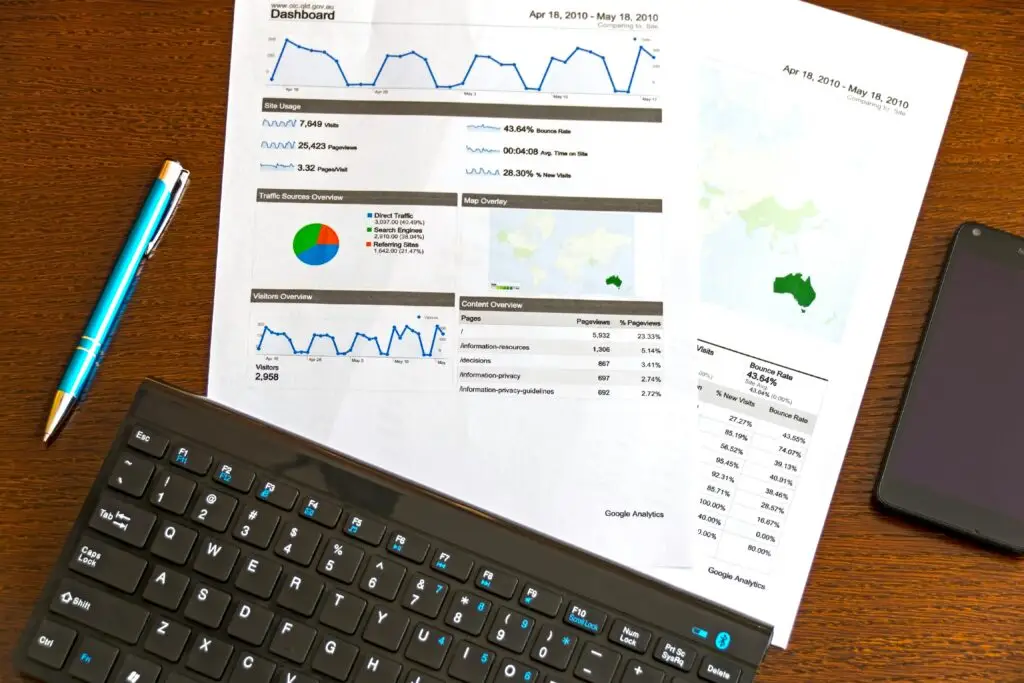
Power BI dashboards have become the standard way businesses see and use their data – and for good reason. They turn scattered information into one clear, interactive view. Here’s the power and utility of Power BI dashboards, and how to get the most from them.
Beacon builds on Microsoft Power BI, the industry-leading analytics platform.
Why Power BI dashboards are so powerful
- Everything in one place – all your sources, one view
- Live and interactive – filter, drill and explore
- Always current – automated data refreshes
- Accessible anywhere – desktop, web and mobile
Getting the most from Power BI dashboards
The utility of Power BI dashboards comes from the build – clean data, the right measures and a design people use. Done well, they become the daily tool your business runs on.
Related: how to make the best dashboard and Power BI vs Tableau.
Frequently asked questions
What can Power BI dashboards do?
They bring all your data into one live, interactive view – tracking KPIs, spotting trends and supporting decisions in real time.
How do we get a Power BI dashboard built?
Tell us your data and what you want to see; we scope, build and hand it over. See our guide to Power BI dashboard cost.
Ready to turn your data into decisions? Beacon Data Analytics works with clients worldwide – we’re always open for emails and online meetings. Get in touch or email info@beacondataanalytics.com.